
When a low-income homeowner needs a new roof, waiting nearly two years isn't simply an administrative inconvenience. It can mean living with a deteriorating home while navigating a complicated process that was specifically created to provide assistance.
That was the challenge uncovered during a process review of a Ontario Municipal housing renovation assistance/subsidy program.
The program helped eligible homeowners complete critical repairs—including roofs, electrical and heating systems, plumbing, windows, foundations and accessibility improvements.
On paper, the program worked.
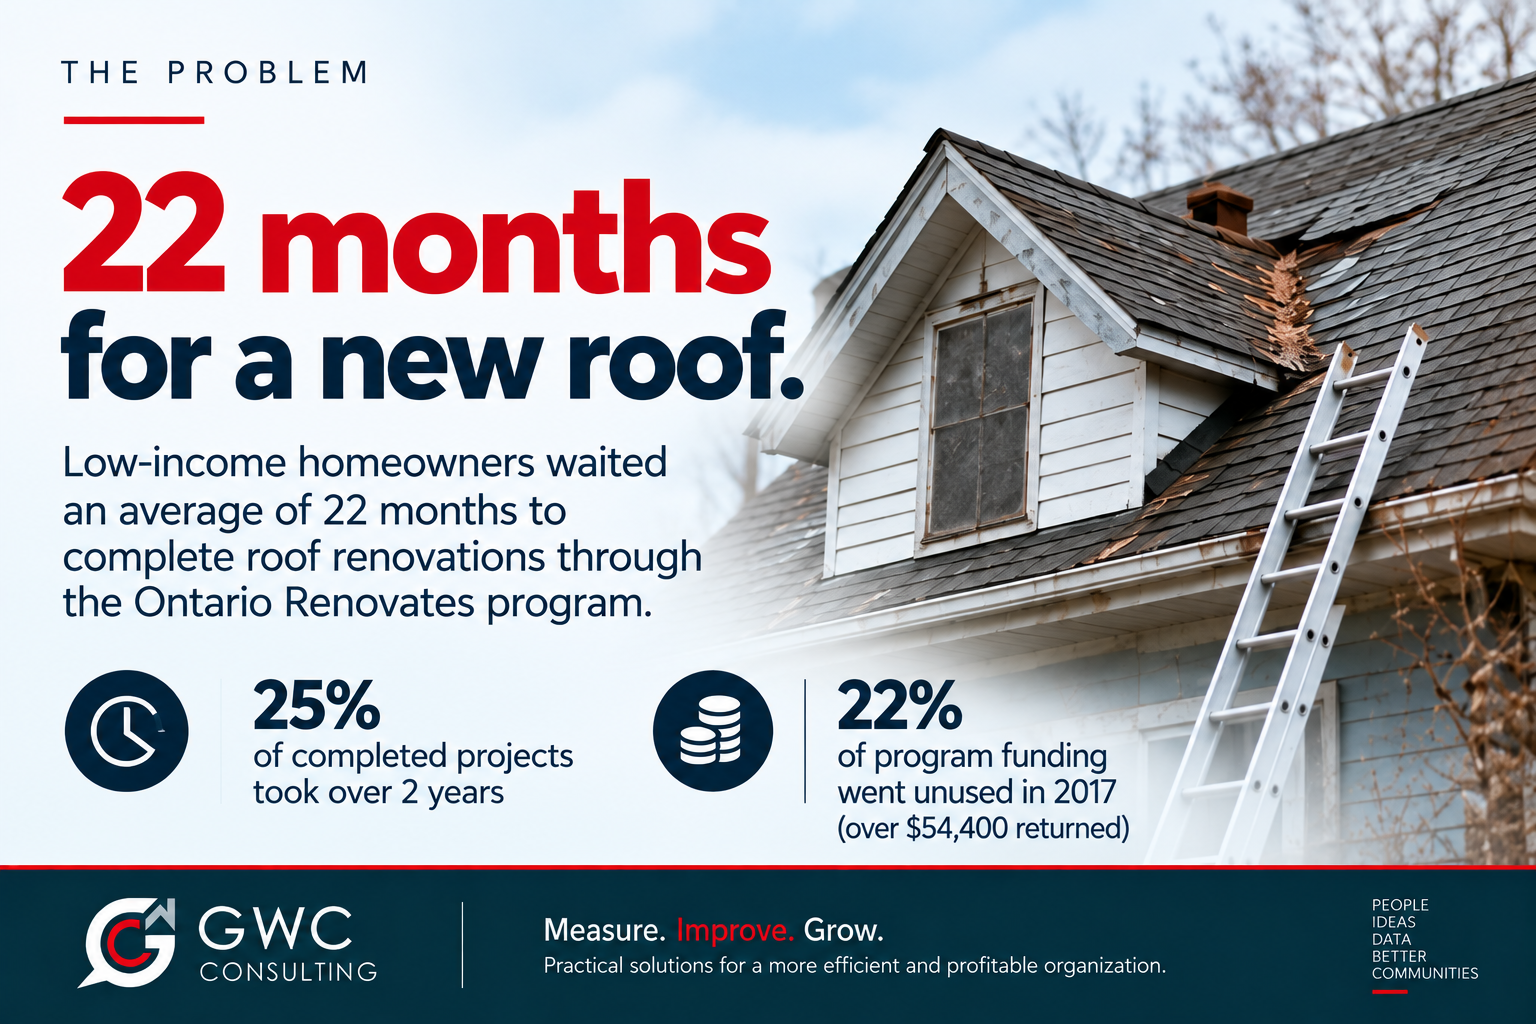
In practice, it was taking an average of approximately 22 months to move a project from application to completion.
Some projects took more than three years.
The slow process was even contributing to program underspending: in 2017, 22% of the available funding went unused, resulting in more than $54,000 being returned.
The question was straightforward:
Where was all that time going?
The Problem: A 22-Month Process
One of the first lessons was that perception wasn't enough. People working within different parts of the program had very different estimates of how long a typical project took. Program staff estimated six months. Management estimated eight months. Inspectors estimated twelve months.
The data told a very different story: Approximately 22 months.
That gap is exactly why performance measurement matters.
Organizations can become accustomed to the way a process operates. Individual employees see their own portion of the work, but few people see the entire customer journey from beginning to end. So we stopped estimating and started measuring!
Step 1: Measure the Entire Journey
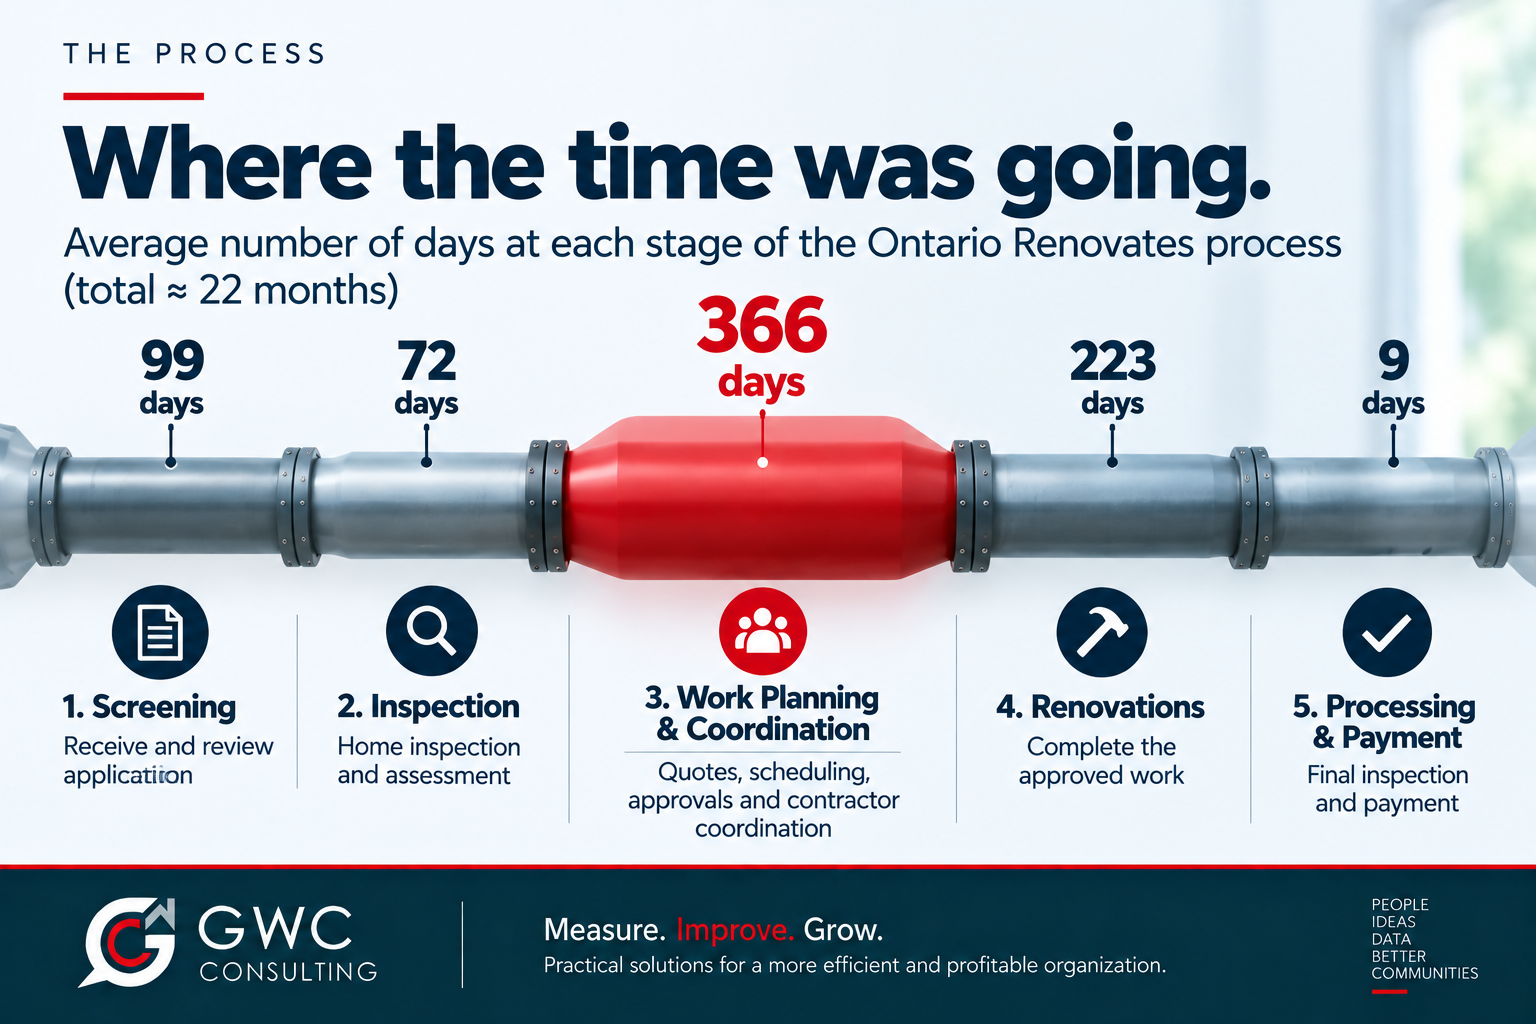
We mapped the process from the moment an applicant entered the program through to the final inspection and payment. Rather than treating the program as a single process, we divided it into five major phases:
Screening → Inspection → Work Planning & Coordination → Renovations → Processing & Payment
The results immediately showed that the delays weren't evenly distributed.
The largest bottleneck was work planning and coordination: approximately 366 days—nearly half of the entire process.
That changed the conversation. We no longer had a vague problem called “the program takes too long.”
We had identified where the problem lived!
Step 2: Find the Bottleneck
We then broke the work-planning and coordination phase down even further. This stage included finding contractors, obtaining multiple quotes, scheduling inspections, reviewing quotations, preparing documentation, communicating between staff and inspectors, obtaining signatures and eventually authorizing the work.
The analysis revealed something important: Much of the elapsed time wasn't productive work. It was WAITING.
Customers waited for contractors. Contractors waited for customers. Appointments had to be coordinated. Some applicants weren't sure what they were supposed to do next. Others had to save money before they could pay for an electrical inspection required to move their application forward. And when a customer stopped moving, there wasn't an effective system ensuring that someone proactively moved the file to its next stage. The process depended too heavily on the applicant knowing what to do next.
RED FLAG: For a program serving people who were already facing financial challenges, forcing these people to pay hundreds of dollars for inspections was a significant program design problem.
Step 3: Listen to the Customer
The numbers told us where the delays were occurring. Talking to the people involved helped explain why.
One customer reported that obtaining quotes had taken almost a year because they didn't know where to begin or whom to contact. A contractor described homeowners, especially seniors and those with disabilities, as overwhelmed by the process and uncertain about what happened next. Even inspectors reported receiving questions from customers that they couldn't always answer.
This wasn't simply a processing-time problem. It was also a communication and process-ownership problem.
The customer needed to know three things throughout the process: Where am I now? What happens next? Who is responsible for making it happen? The existing process didn't consistently answer those questions.
Step 4: Identify the Root Causes
Once the process had been measured and analyzed, five underlying problems emerged.
The review identified:
Poor customer communication
A workflow in which too many activities occurred sequentially rather than concurrently
Insufficient communication between staff involved in different parts of the program
Financial barriers imposed on applicants, whom have no financial resources; and
Inadequate record keeping and progress monitoring.
Most importantly, there was no effective system for tracking a file through the entire process and identifying when it had stopped moving.
You can't manage a process you can't see.
Step 5: Redesign the Process
The solution wasn't simply to tell employees to work faster. We redesigned how the work moved.
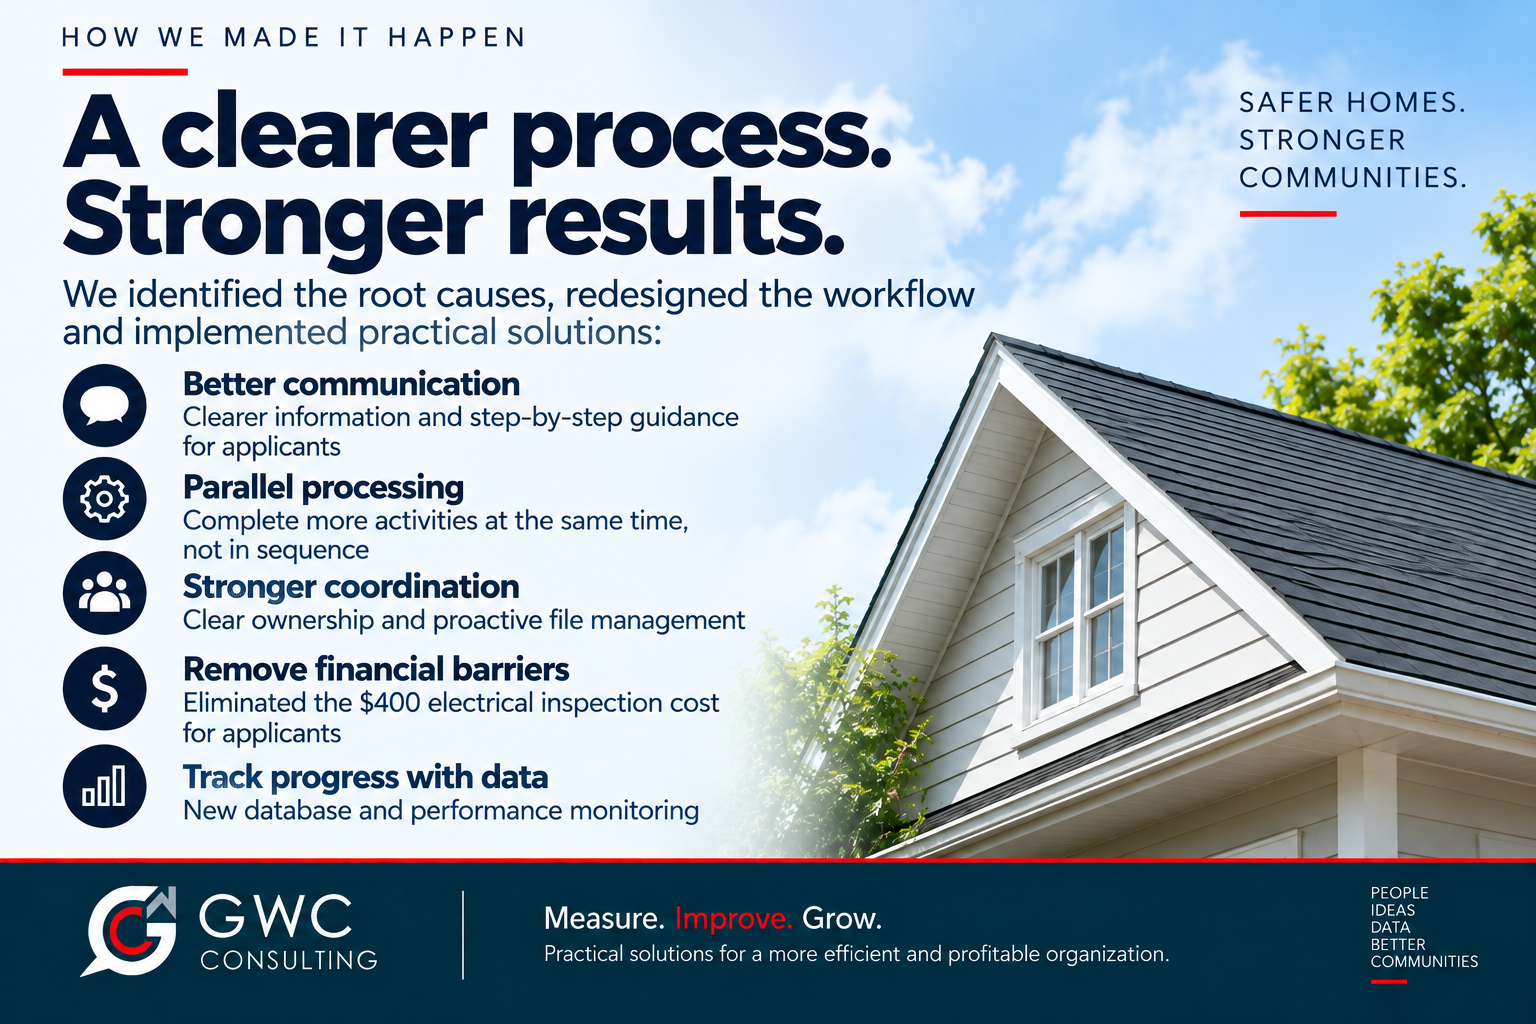
First, applicants needed better information. A background package would explain the program before they entered it, while a step-by-step guide would tell successful applicants exactly what would happen next.
Second, work that had previously happened sequentially could be simplified, moved earlier in the process, or completed in parallel. The objective was to eliminate unnecessary gaps between stages rather than simply accelerating individual tasks.
Third, communication between the employees and departments involved in the program needed to become structured rather than incidental.
Fourth, an unnecessary financial barrier was removed. Applicants had been required to pay approximately $400 for an electrical inspection as part of a program intended to provide financial assistance. The redesigned process called for the City to absorb that cost instead.
Finally, the program needed something it previously lacked:
a way to manage itself using data.
An electronic database would track every project, its current stage and its progress. Program benchmarks would establish expectations for how long each stage should take. A file could no longer simply disappear into the process
From 22 Months to 12
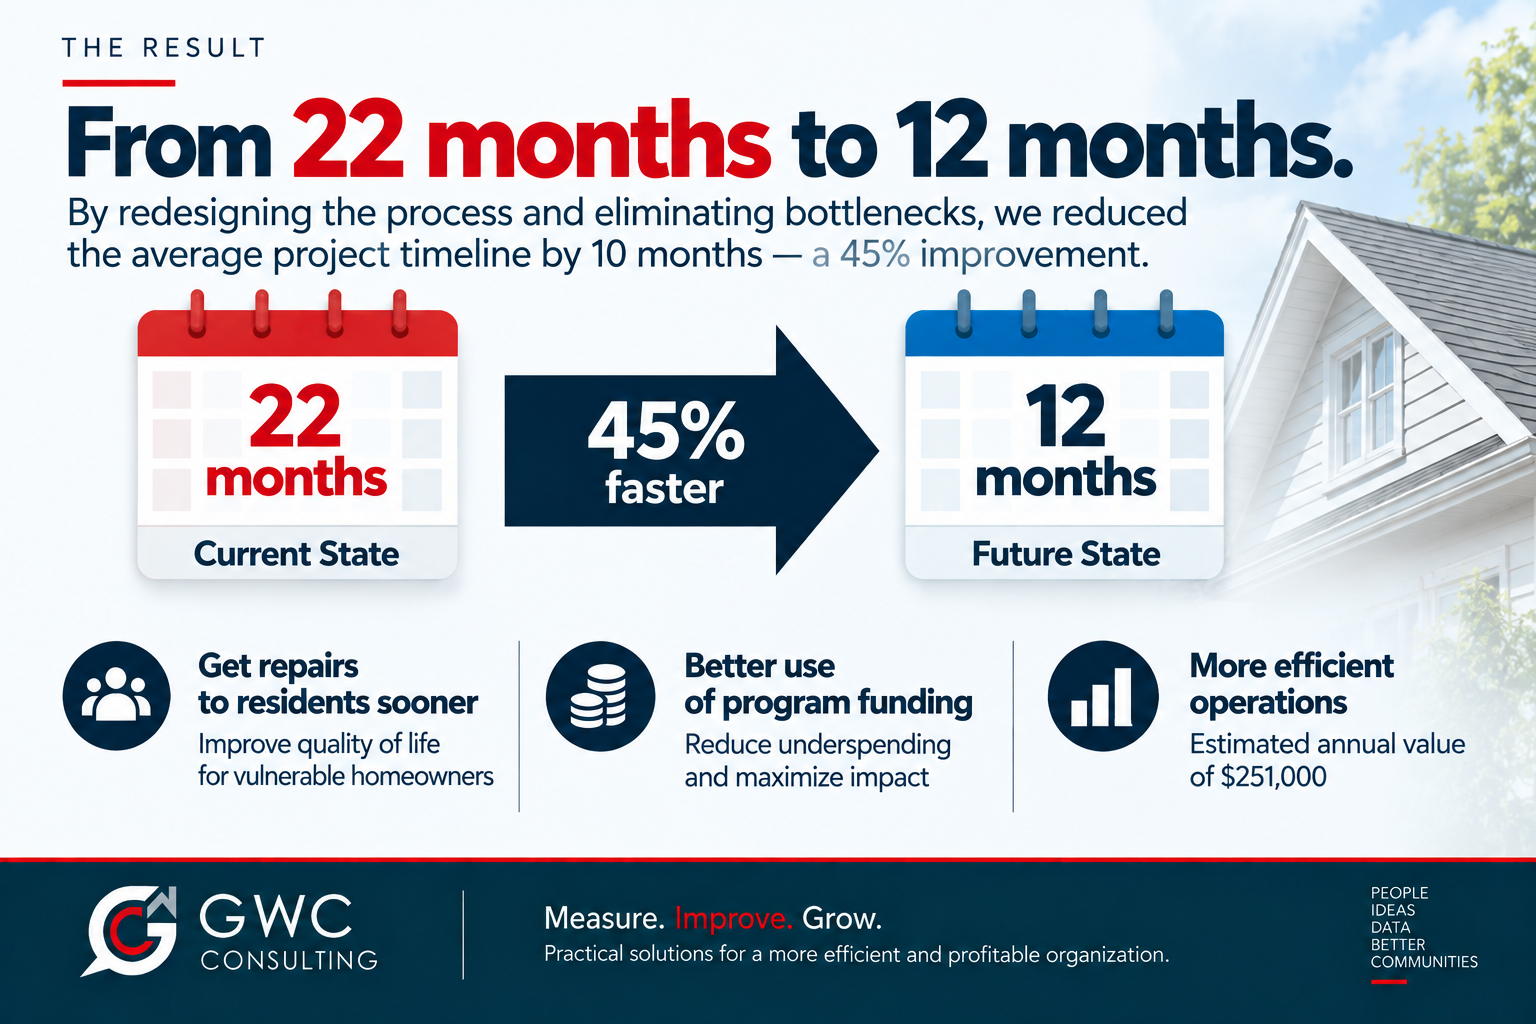
The redesigned future state established a target of reducing the average project timeline from approximately 22 months to 12 months.
That's a reduction of roughly 10 months—or more than 45%—without eliminating the underlying service.
The improvement came from redesigning how the service was delivered: better communication, fewer gaps, work performed in parallel, removal of an unnecessary financial barrier, clearer ownership, and active progress monitoring.
The Bigger Lesson: Measure the Process, Not Just the Program
Organizations often measure how much money they spend, how many applications they receive, or how many projects they complete. Those are useful measures. But they don't necessarily tell you how well the process works.
In this case, the most revealing question wasn't: How many renovation grants did we provide?
It was: How long does a resident wait between asking for help and actually getting their home repaired—and why?
Once the process was measured from the customer's perspective, the opportunities for improvement became much clearer. That's the value performance measurement and process improvement.
Measure the journey. Find the bottleneck. Fix the process. Track the result.
Because sometimes the biggest opportunity for improvement isn't doing more. It's making what you're already doing work better.
GWC Consulting helps organizations measure performance, identify inefficiencies and redesign processes to deliver better results with the resources they already have.
